- El consultorio / Programación de citas en línea
- Compresiones vasculares
- ¿Tiene alguna pregunta?
- Lista de control Síndromes de compresión vascular
- Lordosis – Causa de numerosos síndromes de compresión abdominal
- Síndrome de May-Thurner/ síndrome de Cockett/ síndrome de compresión de la vena ilíaca
- Síndrome de la línea media (síndrome de congestión de la línea media)
- Síndrome de congestión pélvica (congestión de los órganos pélvicos)
- Compresión del tronco celíaco /síndrome de Dunbar/ síndrome de AMS/ síndrome del ligamento arcuato
- Síndrome de Wilkie/ síndrome de la arteria mesentérica superior
- Compresión de la vena cava inferior
- Neuralgia púdica en los síndromes de compresión vascular
- Tratamiento de los síndromes de compresión vascular
- Síndromes de compresión vascular que he detectado recientemente
- Kaleidoscope of instructive cases
- Servicios
- Ultrasonido Doppler color funcional – lo que entiendo por esto
- Medición de la circulación sanguínea – Método PixelFlux
- Investigación
- Perfil
- Infección por virus Borna
- Colaboración científica
- Cookie Policy
- Cookie Policy (EU)

Ejemplo del efecto de la lordosis lumbar en la compresión de las venas abdominales
En esta página daré algunos ejemplos sobre el mecanismo de la compresión lordótica de las estructuras delante de la columna vertebral, que conduce a los síndromes de compresión abdominal.
En el primer ejemplo, una lordosis fuerte comprime la vena cava inferior en un paciente:
En las imágenes Doppler en color, el flujo sanguíneo se codifica en diferentes colores:
El rojo se asigna al flujo hacia la superficie del cuerpo,
azul se asigna al flujo que se aleja de la superficie del cuerpo,
verde se asigna a un flujo turbulento que apunta a una aceleración o perturbación patológica del flujo sanguíneo.
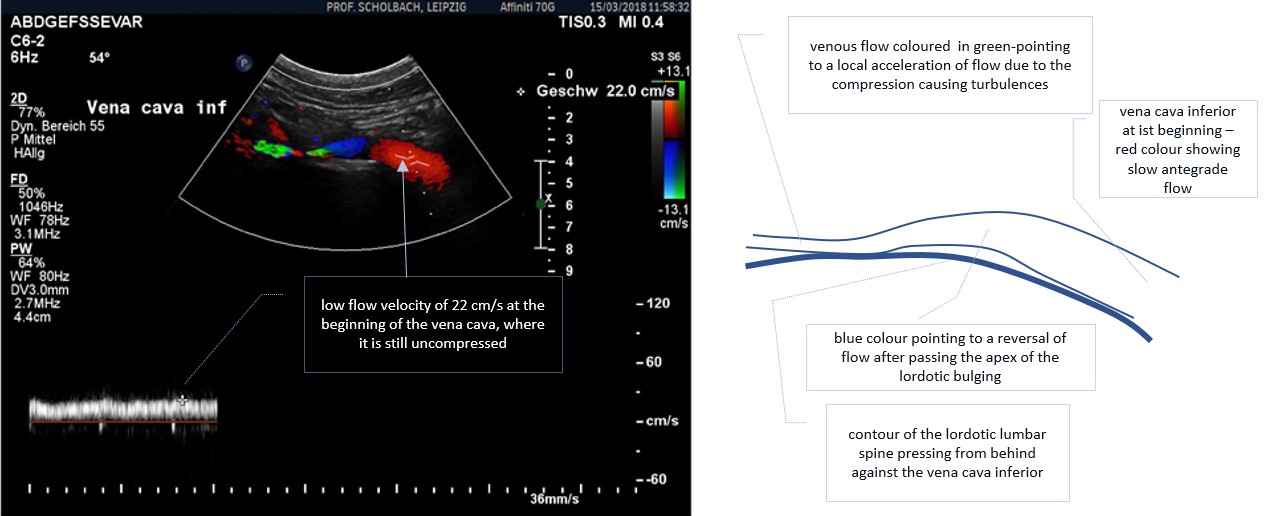
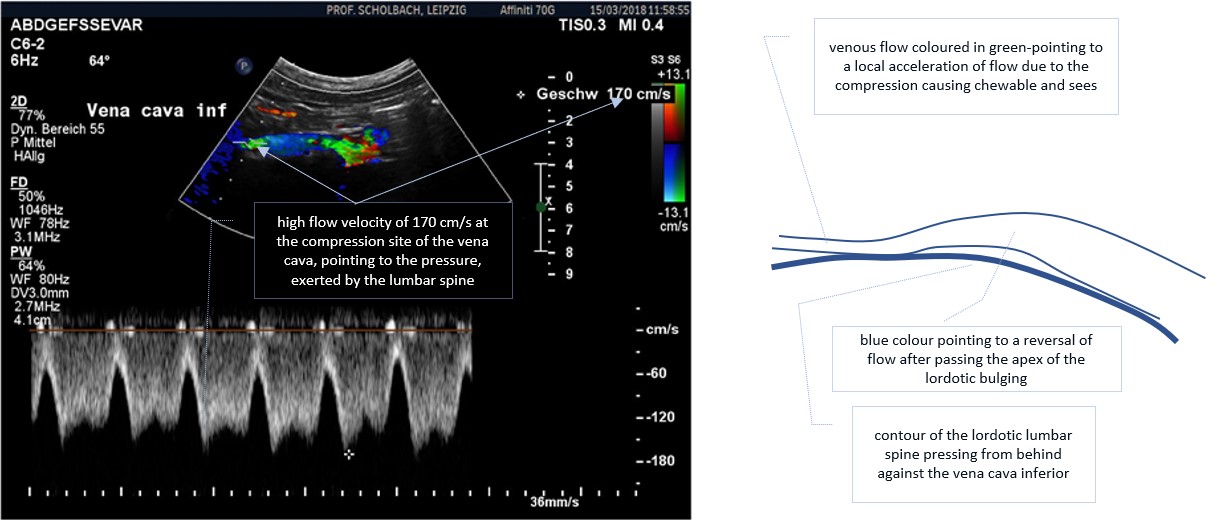
Las imágenes de arriba demuestran el hecho de la compresión de la vena cava por la columna vertebral lordótica. Al principio, donde la vena todavía es ancha, el flujo es bastante lento -22 cm/s. Unos pocos centímetros más arriba, donde ocurren las turbulencias, la velocidad del flujo aumenta rápidamente a un valor que es ocho veces más alto de lo normal.
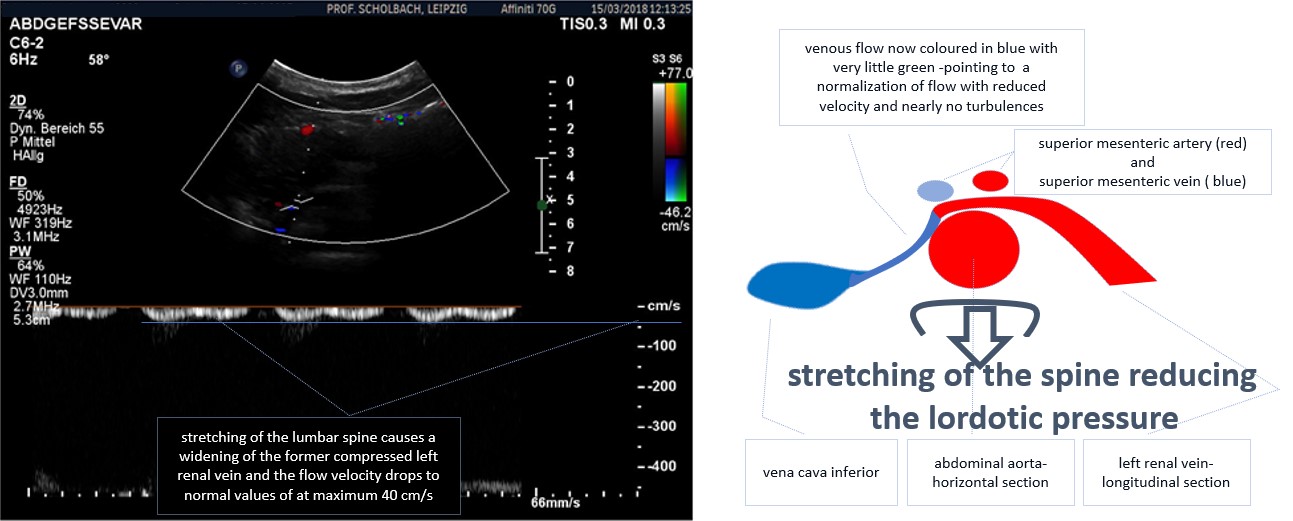
La imagen de abajo muestra la compresión severa de la vena renal izquierda en el síndrome del cascanueces. La compresión es ejercida por la protuberancia anterior de la columna lumbar, presionando desde atrás contra la aorta. La aorta levantada luego comprime la vena renal izquierda por detrás, causando así una aceleración extrema del flujo a 346 cm/s en una vena. Esto es aproximadamente 15 veces la velocidad normal del flujo en la vena renal izquierda. Las siguientes imágenes muestran el efecto de la descompresión mediante el estiramiento activo de la columna lumbar, contrarrestando así la lordosis y reduciendo la presión lordótica. Las turbulencias desaparecen casi por completo, y la velocidad del flujo desciende a una novena parte de los valores anteriores, señalando así la reducción de la presión venosa en el mismo rango.
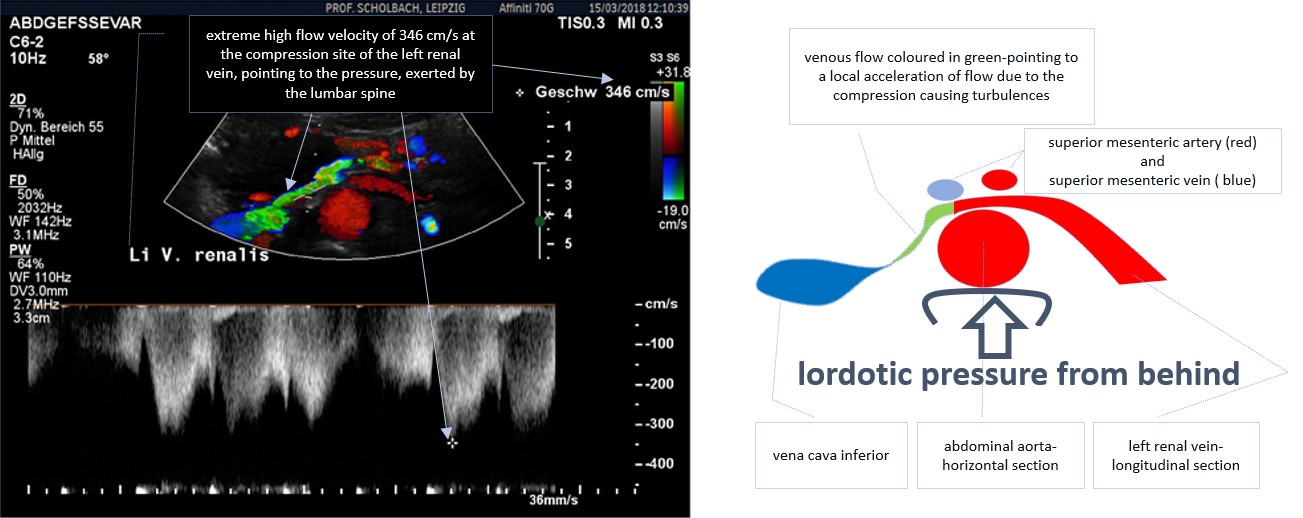
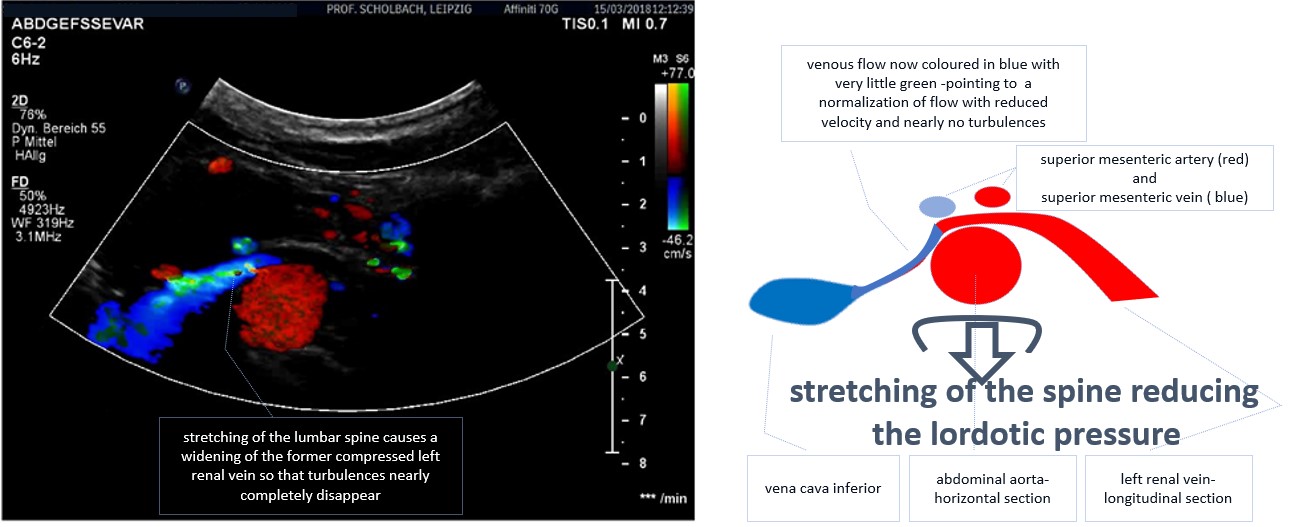
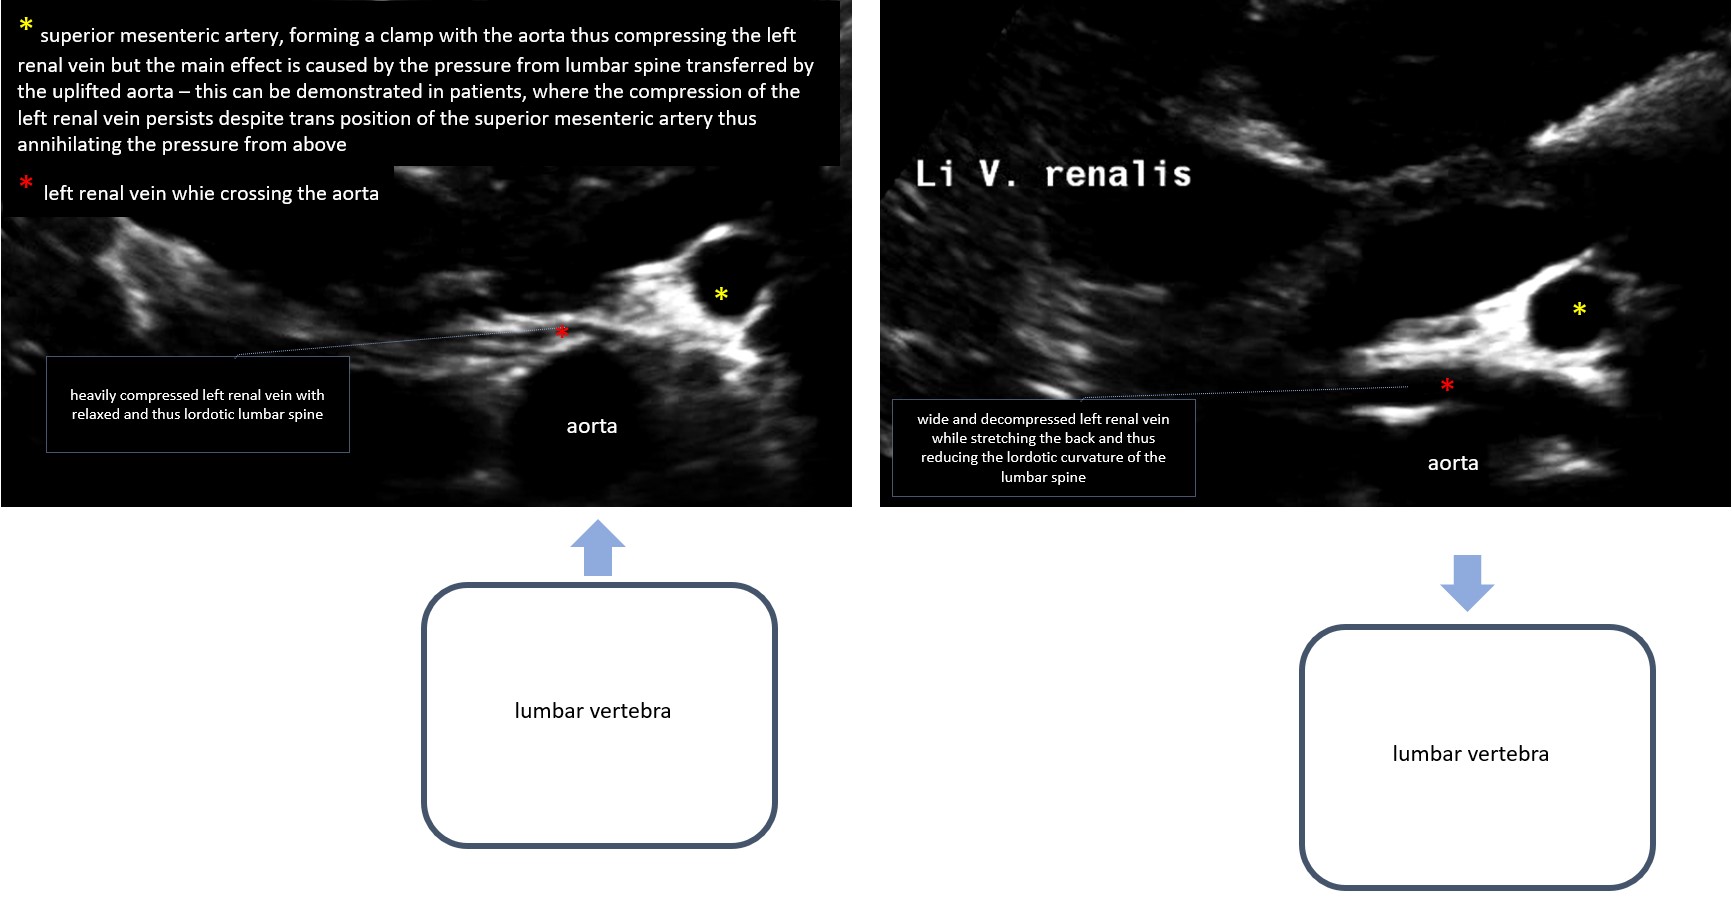
Las siguientes imágenes muestran el efecto de la presión de la columna lumbar sobre la compresión de la vena renal izquierda en el cascanueces arterial visto en una sección horizontal.
La visión convencional del síndrome del cascanueces es que la vena es sujetada por ambas ramas del cascanueces – la arteria mesentérica superior delante de la vena así como la aorta detrás de la vena. Pero las observaciones en pacientes en los que la arteria mesentérica superior fue trasplantada hacia abajo para aliviar el síndrome de Wilkie dan evidencia clara de que la descompresión de la rama frontal del cascanueces, la arteria mesentérica superior, no reduce suficientemente la presión de la vena renal izquierda. La presión principal es ejercida por la aorta desde atrás.
En la imagen de la izquierda, el paciente se encuentra en una postura corporal relajada, es decir, «normal». La vena renal izquierda es comprimida casi completamente por la aorta desde atrás.
En la imagen de la derecha, el paciente está reduciendo la presión de la columna lumbar al estirarla. El efecto es claramente visible: La vena renal izquierda se ensancha debido a la presión reducida de la aorta. Debido a que la aorta está firmemente conectada a la columna lumbar, funciona como una barra de elevación. La alta presión en la aorta endurece el vaso. Por lo tanto, puede transferir la presión de la columna lumbar hacia las estructuras situadas delante de la aorta.
La evaluación del efecto de la lordosis sobre los síndromes de compresión vascular se basa en la técnica PixelFlux.
Este método permite una descripción detallada sin precedentes del efecto hemodinámico de los síndromes de compresión vascular y su tratamiento.
El siguiente diagrama muestra el efecto de la lordosis en la vena renal izquierda en un paciente con síndrome del cascanueces. Aquí, la supresión de la perfusión de la vena renal izquierda es obviamente más pronunciada en la lordosis máxima y se reduce por la flexión de la cadera y por lo tanto la reducción de la lordosis de la columna lumbar.
![]()
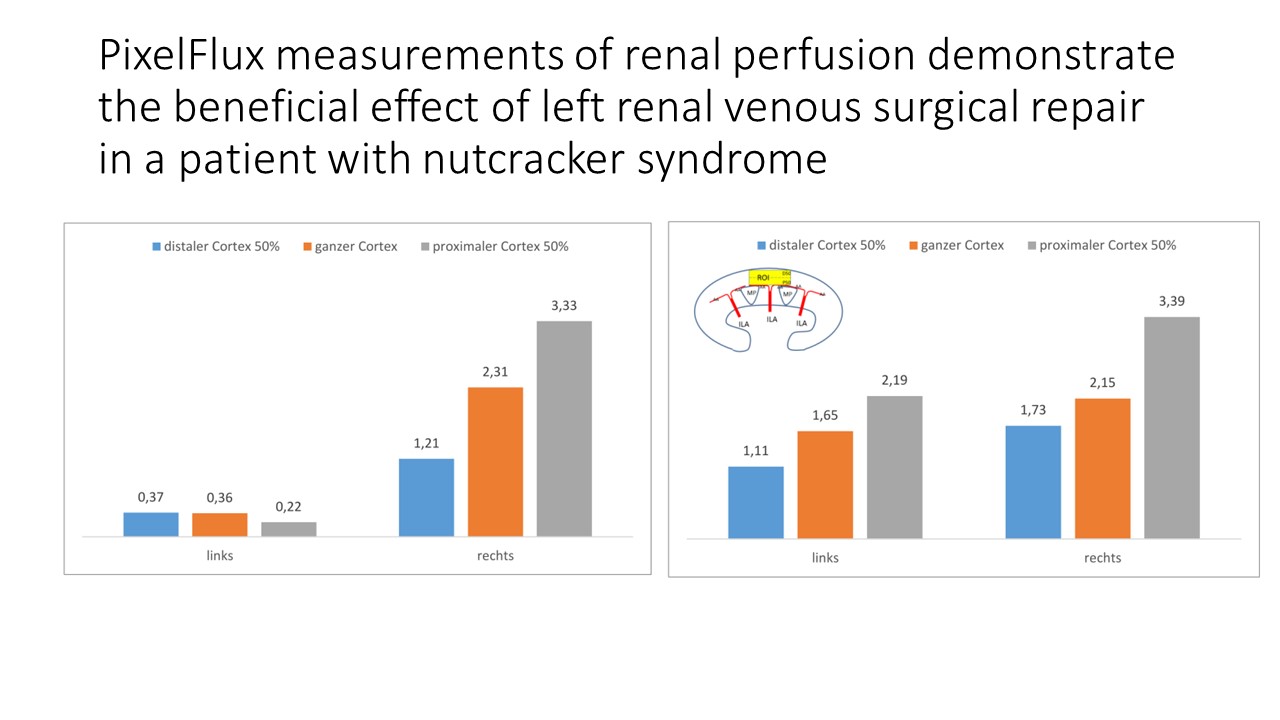
El siguiente diagrama muestra el efecto de la obstrucción del flujo venoso renal izquierdo sobre la perfusión del parénquima del riñón izquierdo (enlaces). Las mediciones de PixelFlux demuestran una supresión del flujo sanguíneo en el riñón izquierdo (enlaces) a aproximadamente 1/10 a 1/4 del riñón derecho (retardo), dependiendo de la capa de vasos parenquimatosos (corteza proximal vs. distal).
Sólo las mediciones de PixelFlux pueden mostrar claramente que hay un efecto tremendo del síndrome del cascanueces en la perfusión renal izquierda (enlaces). Estas mediciones son una condición previa indispensable para tomar una decisión acertada, ya sea para operar o no.
En el diagrama de la derecha, el éxito de la intervención quirúrgica vascular queda demostrado una vez más por la técnica PixelFlux. El aumento de la perfusión renal izquierda se puede demostrar y llega al factor de 4-10, de nuevo dependiendo de la capa de vasos corticales.
