- New stuff to read and discuss
- What patients say
- Clinic / online appointments
- Why the diagnosis of a psychosomatic illness is often a misdiagnosis
- Vascular Compression Syndromes
- Do you have questions?
- Checklist vascular compression syndromes
- Description of your symptoms
- Researchers from the Mayo Clinic confirm my concept of the Midline Congestion Syndrome
- Explanation of gender-specific differences in the clinical symptoms of abdominal vascular compression syndromes: varicocele and penile/testicular pain – their main manifestation in men.
- Varicocoele is predominantly caused by left renal vein compression
- Musculoskeletal pecularities of female puberty
- Lordosis /Swayback- Origin of many abdominal compression syndromes
- Bending of a straight vein compels its narrowing
- The lordogenetic midline congestion syndrome
- Neurological consequences of the midline congestion syndrome
- Successful treatment of a teenage girl who was unable to eat due to extreme postprandial pain and unable to walk due to spasticity in her left leg
- Severe ataxia in a young woman with severe spinal congestion – complete resolution after decompression of the left renal vein
- All compression syndromes are one: the spectrum of lordogenetic compressions
- Nutcracker-Syndrome is a misnomer! Lordogenetic left renal vein compression is a more appropriate name!
- May-Thurner-constellation (May-Thurner-syndrome, Cockett’s syndrome)
- Midline (congestion) syndrome
- Pelvic congestion syndrome
- Celiac Trunk Compression / Dunbar syndrome / MALS / Arcuate ligament syndrome
- Wilkie-Syndrome / Superior-mesenteric-artery-syndrome
- Compression of the vena cava inferior
- Evlauation of vascular compressions with the PixelFlux-method
- Connective tissue disorders predispose to multiple compressions
- Postural tachycardia syndrome (POTS) – the hemodynamic consequence of vascular compression syndromes and loose connective tissue
- Restless legs-a little known symptom of abdominal vascular compression syndromes
- Pudendal neuralgia in vascular compression syndromes
- A new sonographic sign of severe orthostatic venous pooling
- Migraine and Multiple Sclerosis
- Hemodynamic effect on cerebral perfusion in patients with multiple localised vascular compression.
- Treatment of vascular compression syndromes
- Fatal errors in the treatment of vascular compression syndromes
- Risks of stents in venous compression syndromes
- Surgical treatment of abdominal compression syndromes: The significance of hypermobility‐related disorders
- Nutcracker and May-Thurner syndrome: Decompression by extra venous tube grafting and significance of hypermobility related disorders
- Our surgical treatment of vascular compressions
- Chronic regional pain syndrome (CRPS) caused by venous compression and mechanical irritation of the coeliac plexus
- Vascular compression syndromes and other disease mechanisms I recently detected
- Kaleidoscope of instructive cases
- Venous congestion of the spinal cord may be a potential contributor to the development of paraplegia in patients with spinal muscular atrophy type III (Kugelberg-Welander disease)
- Ultrasound Diagnostics
- A breakthrough in functional sonographic diagnostic – 4D-colour Doppler sonographic flow volume measurements
- 4D-volume flow measurements of jugular and mesenteric veins
- Inauguration of the global volumetric brain perfusion measurement-a gateway for understanding of neurological symptoms
- Ultrasound focused entirely on all of your symptoms
- Ultrasound vs. X-ray
- Vascular Malformations
- Profile
- Functional colour Doppler ultrasound – how I do it
- Perfusion Measurement – PixelFlux-method
- Research
- Publications
- Nutcracker and May-Thurner syndrome: Decompression by extra venous tube grafting and significance of hypermobility related disorders
- Papers authored by Th. Scholbach
- Publications
- Inauguration of measurements of the tissue pulsatility index in renal transplants
- From nutcracker phenomenon to midline congestion syndrome and its treatment with aspirin
- First sonographic tissue perfusion measurement in renal transplants
- First sonographic bowel wall perfusion measurement in Crohn disease
- First sonographic renal tissue perfuison measurement
- First sonographic measurement of renal perfusion loss in diabetes mellitus
- PixelFlux measurements of renal tissue perfusion
- Why I prefer not to publish in journals but in the Internet
- Vessel stretching in nephroptosis – an important driver of complaints
- Publications
- Expertise
- Bornavirus Infection
- Scientific cooperation
- Cookie Policy
- Data protection
- Cookie Policy (EU)
- Impressum
Example for the effect of the lumbar lordosis on the compression of abdominal veins
On this page, I will give some examples on the mechanism of the lordotic compression of structures in front of the spine, thus leading to the abdominal compression syndromes
In the first example, a strong lordosis compresses the vena cava inferior in a patient:
In the colour Doppler images, the blood flow is encoded in different colours:
Red is assigned to the flow towards the body surface,
blue is assigned to the flow away from the body surface,
green is assigned to a turbulent flow which points to an acceleration or pathologic disturbances of the blood flow.
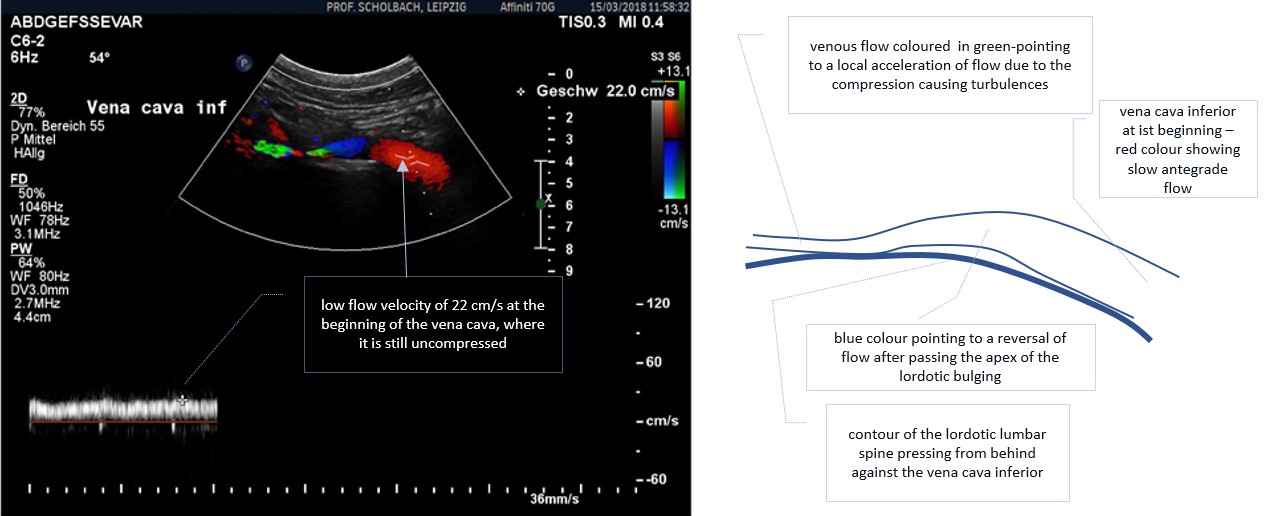
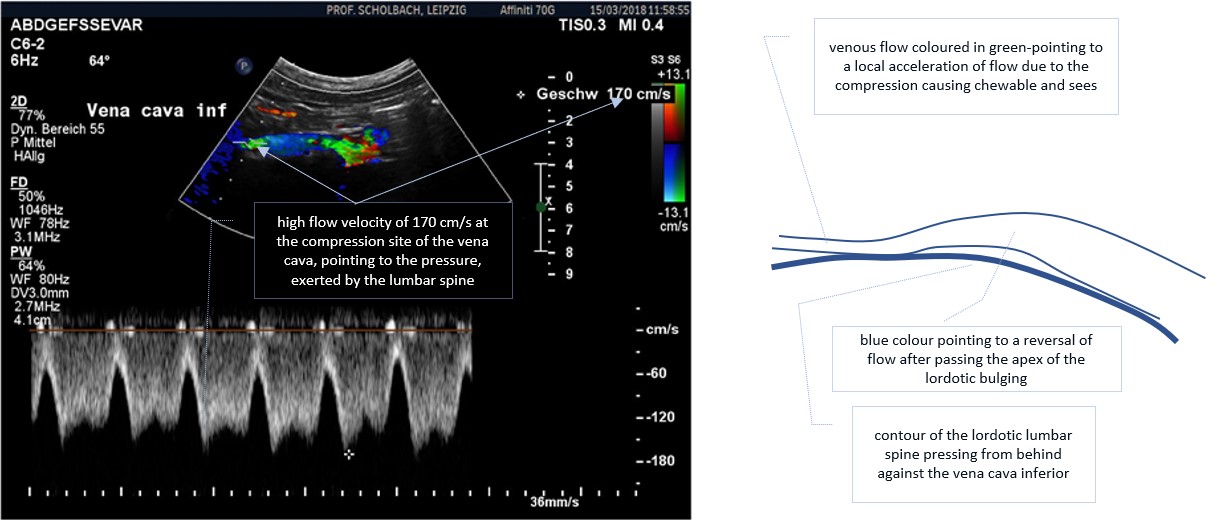
The images above demonstrate the fact of the compression of the vena cava by the lordotic spine. At its beginning, where the vein is still wide, the flow is rather slow -22 cm/s. A few centimeters higher, where the turbulences occur, the flow velocity increases rapidly to a value that is eight times higher than normal.
The image below shows the severe compression of the left renal vein in a nutcracker syndrome. The compression is exerted by the anterior bulging of the lumbar spine, pressing from behind against the aorta. The uplifted aorta then compresses the left renal vein from behind, thus causing an extreme flow acceleration to 346 cm/s in a vein! This is about 15 times of the normal flow velocity in the left renal vein. The images below show the effect of the decompression by active stretching of the lumbar spine, thus counteracting the lordosis and reducing the lordotic pressure. The turbulences nearly completely disappear, and the flow velocity drops to a ninth of the former values, thus pointing to the reduction of the venous pressure in the same range.
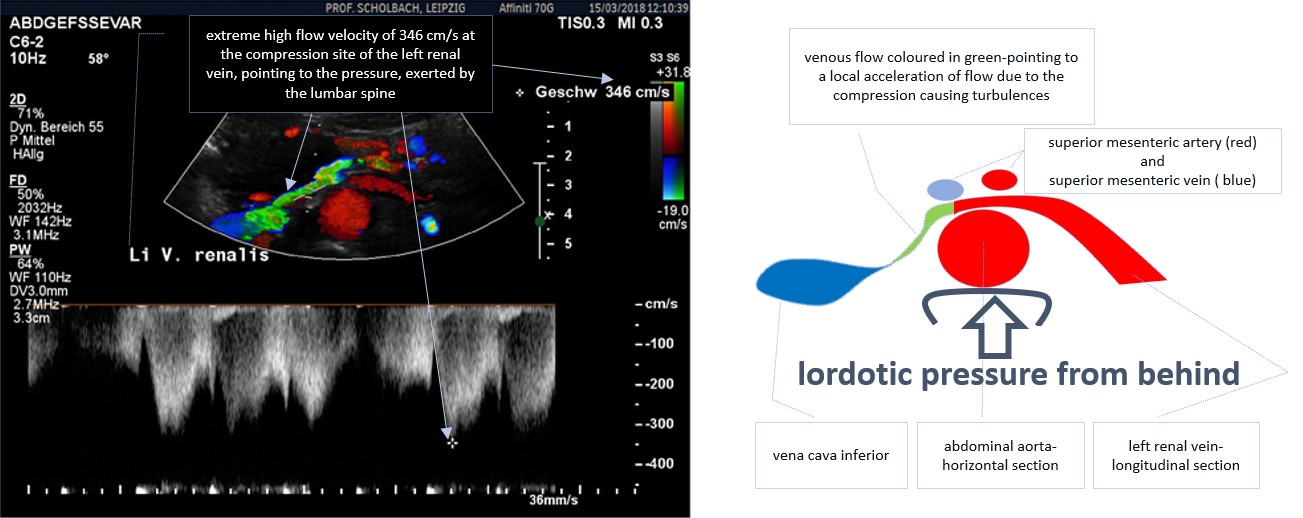
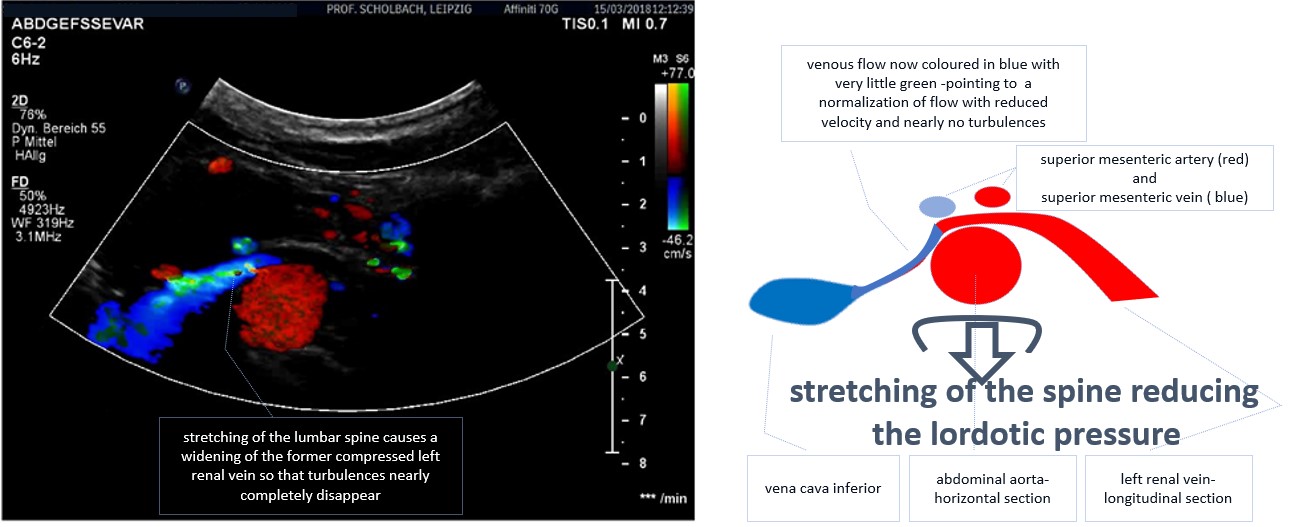
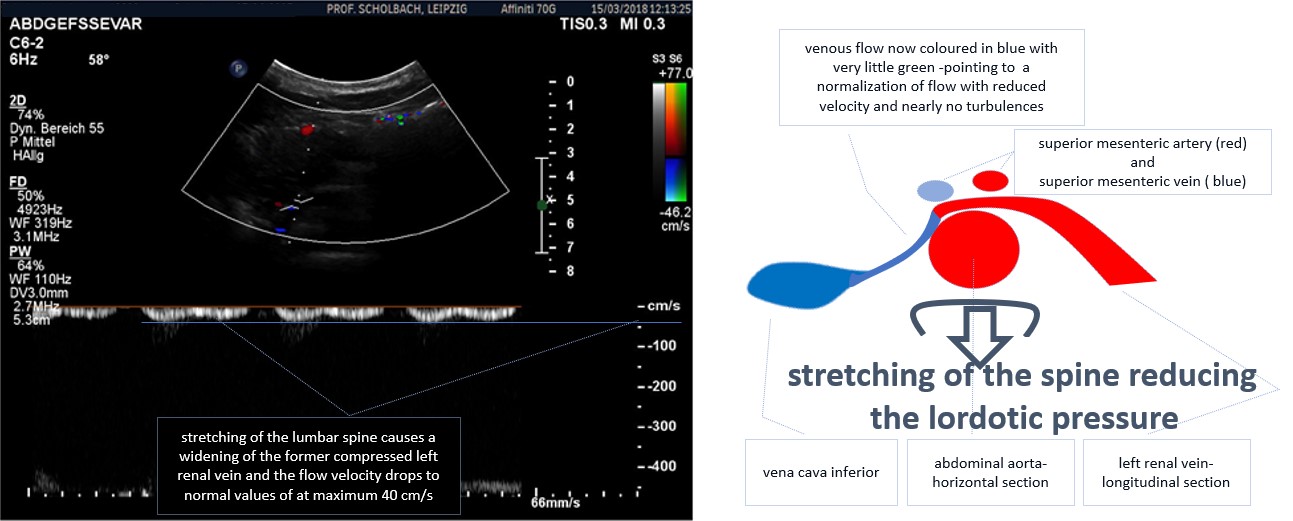
The images below demonstrate the effect of the pressure of the lumbar spine onto the compression of the left renal vein in the arterial nutcracker seen in a horizontal section.
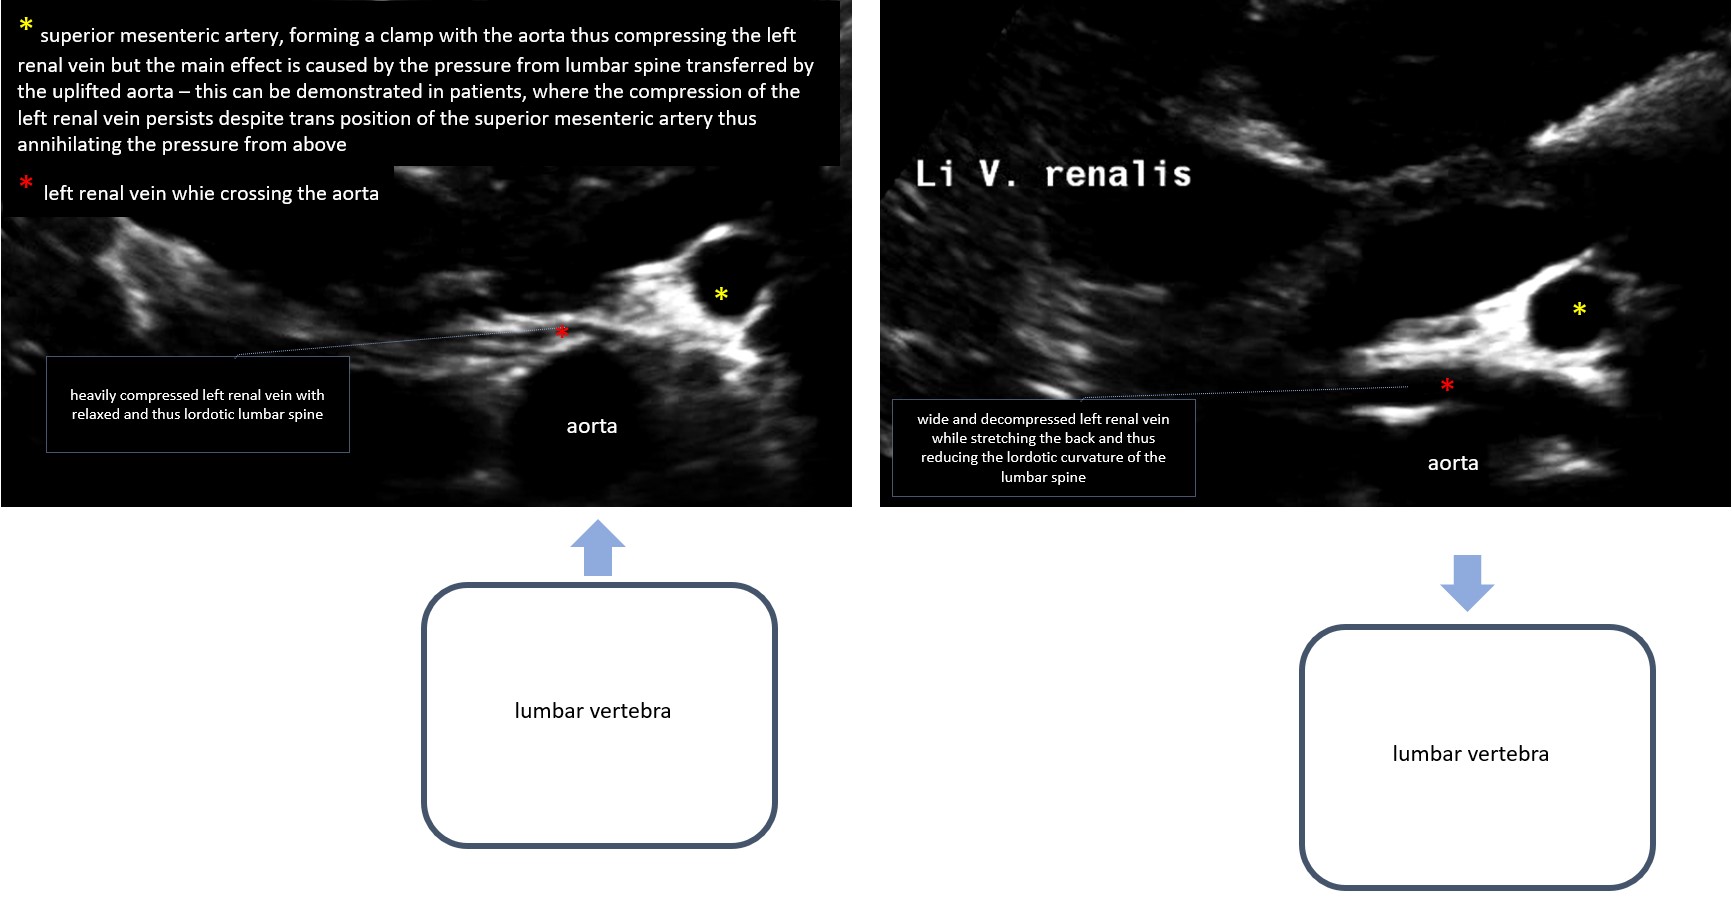
The conventional view of the nutcracker syndrome is, that the vein is clamped by both branches of the nutcracker-the superior mesenteric artery in front of the vein as well as the aorta behind the vein. But observations in patients in whom the superior mesenteric artery was transplanted downwards to relieve a Wilkie syndrome give clear evidence that the decompression from the frontal branch of the nutcracker-the superior mesenteric artery-does not sufficiently reduce the pressure from the left renal vein. The main pressure is exerted by the aorta from behind!
In the left image the patient is in a relaxed, thus “normal” body posture. The left renal vein is nearly completely compressed by the aorta from behind.
In the right image, the patient is reducing the pressure of the lumbar spine by stretching it. The effect is clearly visible: The left renal vein widens due to the reduced pressure from the aorta. Since the aorta is tightly connected to the lumbar spine, it functions as a lifting bar. The high pressure in the aorta stiffens the vessel. So it can transfer the pressure from the lumbar spine towards structures in front of the aorta.
The evaluation of the effect of the lordosis on vascular compression syndromes is based upon the PixelFlux technique.
This method allows an unprecedented detailed description of the hemodynamic effect of vascular compression syndromes and their treatment.
The following diagram demonstrates the effect of the lordosis onto the left renal vein in a patient with a nutcracker syndrome. Here, the suppression of the left renal vein perfusion is obviously most pronounced in maximum lordosis and is reduced by hip flexion and thus reduction of the lordosis of the lumbar spine.
![]()
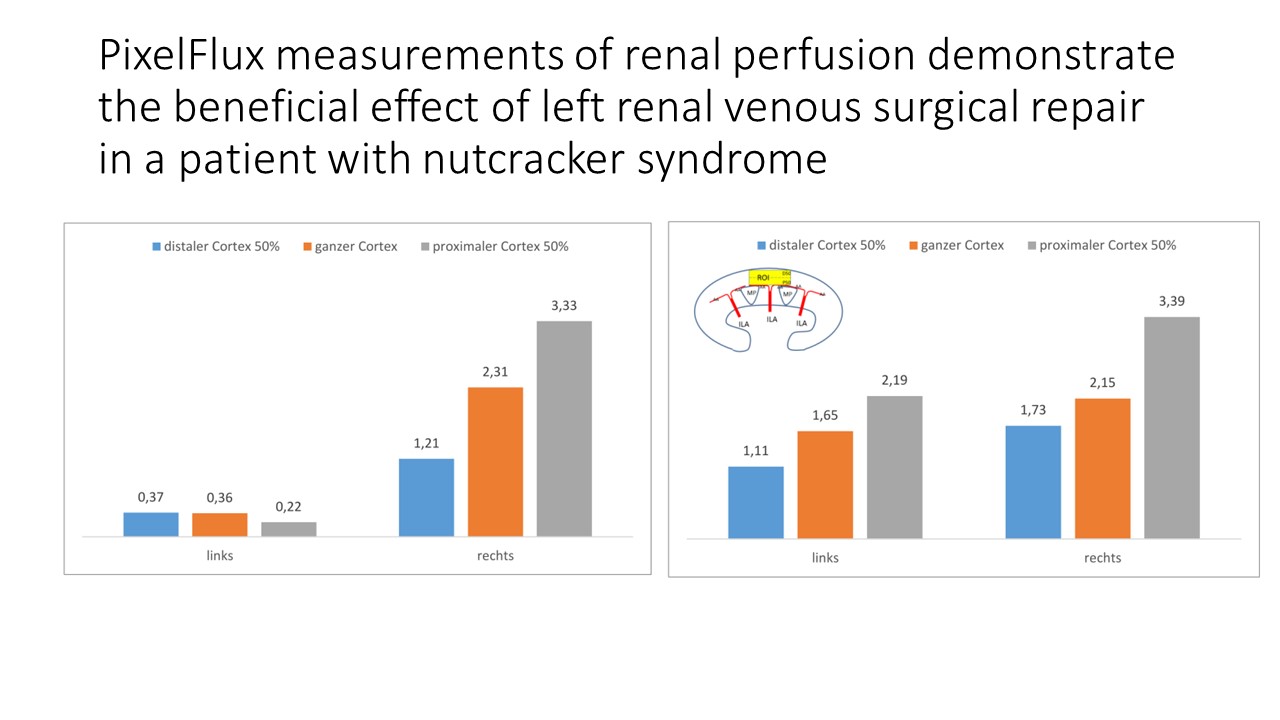
The left diagram below demonstrates the effect of the left renal venous outflow obstruction onto the perfusion of the parenchyma of the left kidney (links). The PixelFlux measurements demonstrate a suppression of blood flow in the left kidney (links) to roughly 1/10 to 1/4 of the right (rechts) kidney, depending on the layer of parenchymal vessels (proximal vs. distal cortex).
Only the PixelFlux measurements can show clearly that there is a tremendous effect of the nutcracker syndrome on the left (links) renal perfusion. Such measurements are an indispensable precondition for a sound decision, whether to operate or not.
In the right diagram, the success of the vascular surgical intervention is demonstrated again by the PixelFlux technique. The increase of the left renal perfusion can be demonstrated and gets to the factor of 4-10, again depending on the layer of cortical vessels.